#monitoring
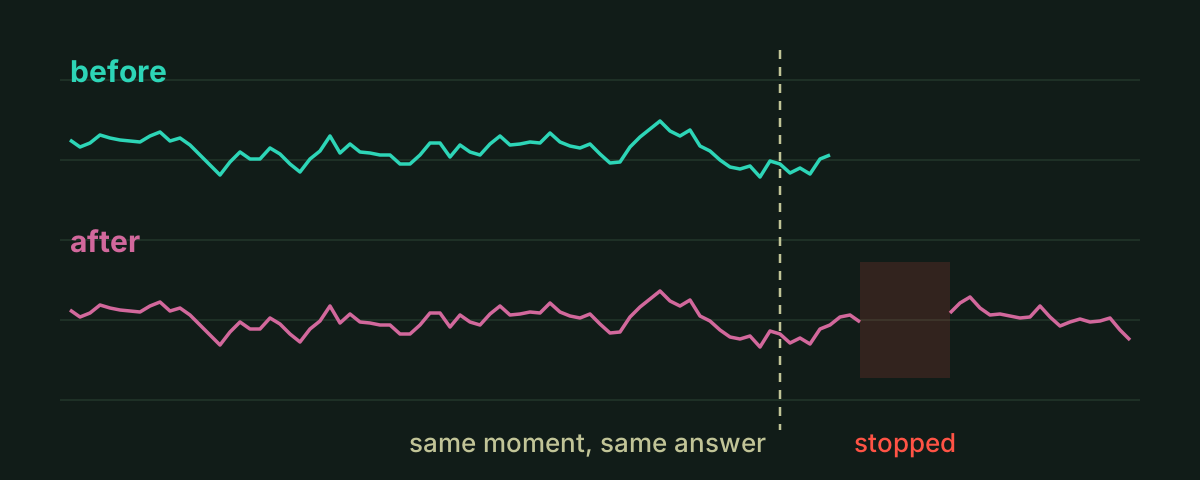 The graphs came back, and that proved nothingI moved Grafana and Prometheus to a new VM and every panel drew straight away. A graph only draws what's there. It can't tell you what's gone.
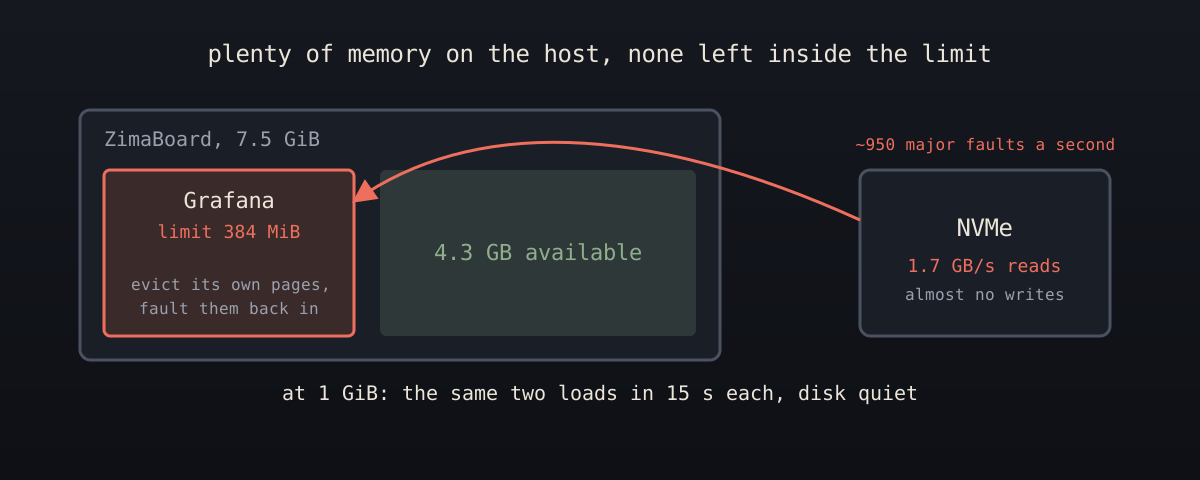 A memory limit made Grafana hammer the diskGrafana stalled for minutes while the host had more than 4 GB of memory available. The clue that it was starving for memory was the NVMe reading 1.7 GB a second.
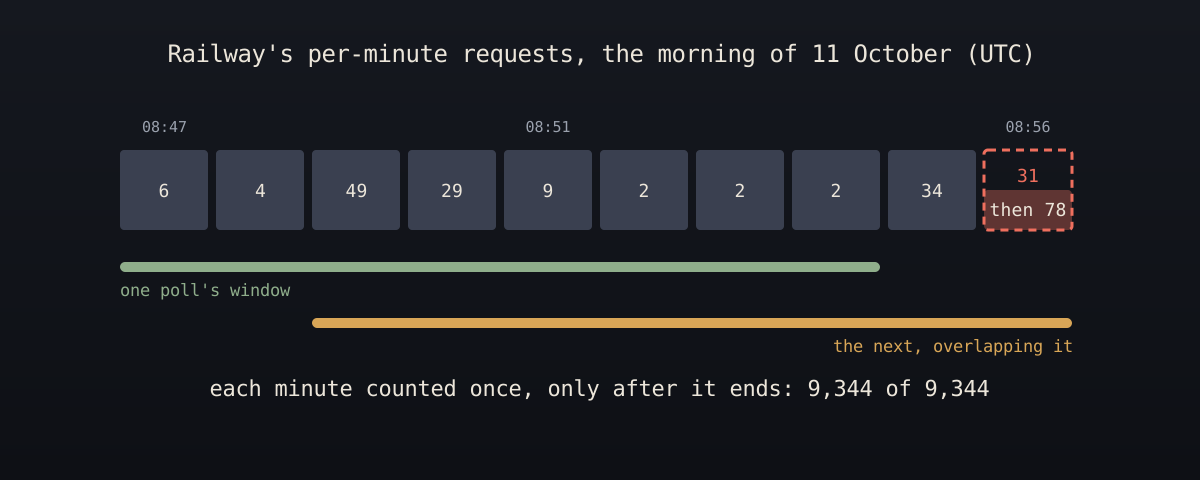 Railway shows my request counts but won't export themRailway's dashboard knows how many requests my app served, but there's nothing for Prometheus to scrape. Turning its per-minute figures into a counter goes wrong three ways.
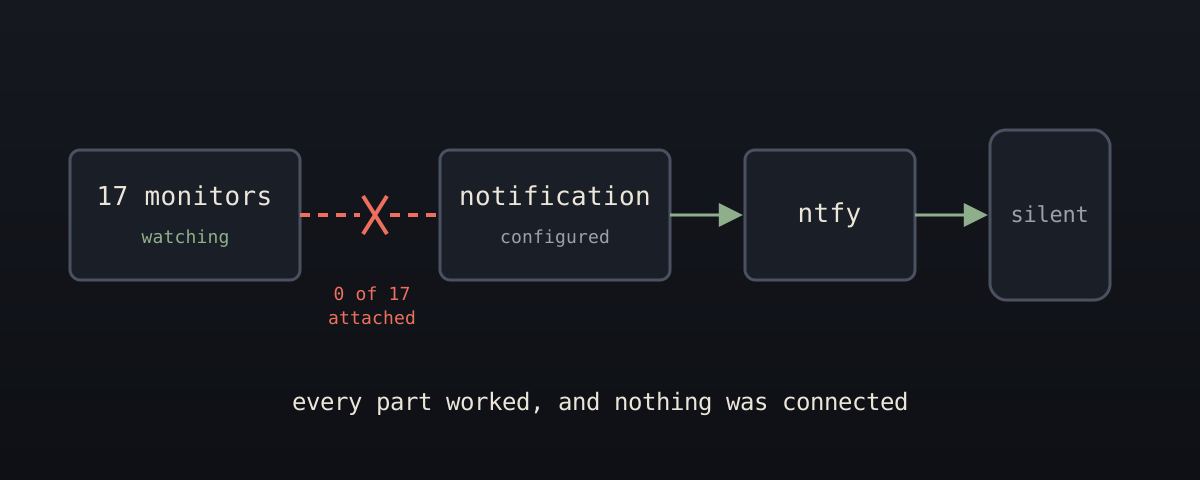 The 03:37 alert that was never sentMy monitoring pinned a 3am outage on Cloudflare within seconds, and my notes said my phone was paged at 03:37. Nothing had been sent, ever.
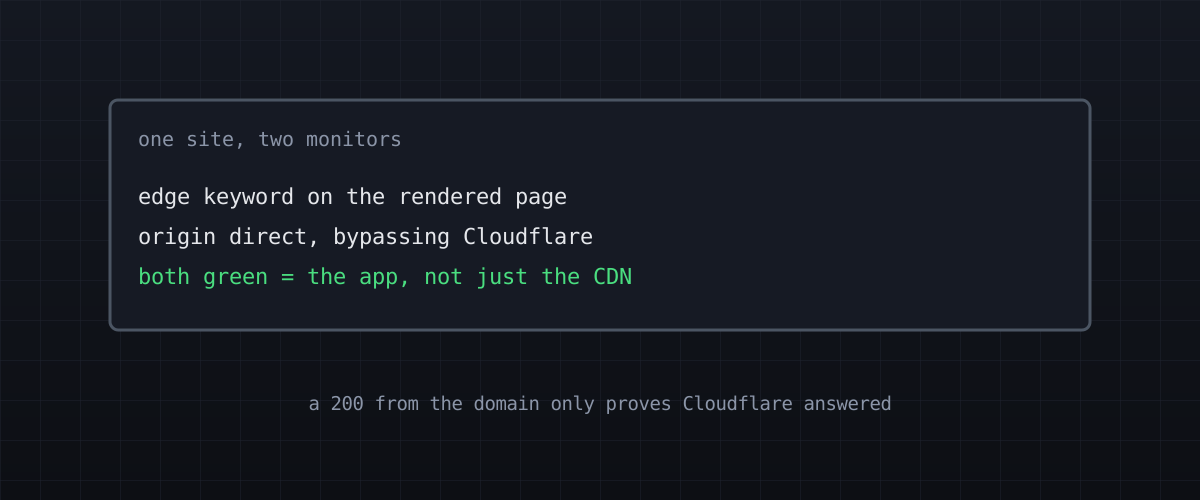 Every site is monitored twiceI set up uptime monitoring for my sites and nearly made every check meaningless. They all sit behind Cloudflare, and a plain HTTP check there proves that Cloudflare answered, not that my app is alive.